Student Sleep


Q.

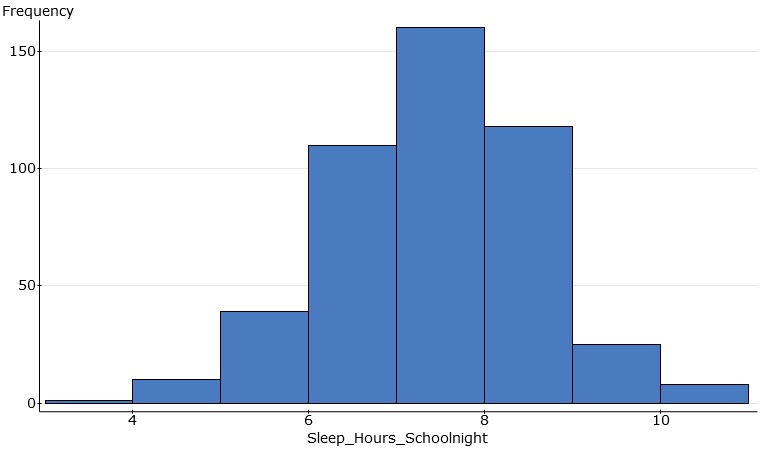
The histogram below shows the distribution of the number of hours a random sample of 471 high school students in Georgia slept on the previous school night. Describe as completely as possible the distribution shown in the histogram, being sure to explain what the graph tells you about the number of hours high school students in Georgia sleep on school nights.


Background Information

This question was developed by Jennifer Kaplan Statistics Education group.

Associated Publications

No Associated Publications


Question Instructions

We recommend that you administer these questions as homework and preface the question with these instructions for students:

"For the following question, please respond to the best of your knowledge and using only the information in the question and what you know. Please do not refer to any outside sources (textbooks, notes, internet, etc.). Any reasonable attempt to answer the question will be awarded full credit."

Find Questions

Upload Data

Review